

Our last update was a huge breakthrough in making the NFL’s data available to everyone. Now, using even more data sources from the NFL’s feeds-rs service, the data has been made more complete and more robust. We dig into this in this article, as well as looking at future plans for extending these data. Continue reading “BigQuery Updates & Future Data Plans”
Democratizing NFL Data
Data is not a resource that should sit in gilded halls, behind locked doors, for only the priveliged few to access. That’s why we’ve been working on publishing these NFL data in a way that would allow anyone with an internet connection to easily access. By using BigQuery from Google Cloud Platform (GCP), these data can be public in a way never before possible.
How Much Is Field Position Worth?

It’s one of the most talked-about topics by commentators in low-scoring games, and a topic we’ve mentioned several times previously – given a known starting position on the field, what’s the outcome? It seems like knowing this could massively affect decisions on the field – let’s check it out. Continue reading “How Much Is Field Position Worth?”
Pittsburgh Has Had The Most Consistent Coaching Run In The NFL
To say that Mike Tomlin and the Steelers have been experiencing some difficulties this year is undeniable. The last time the Steelers went 0-3 was in 2013, and they’ve never made the playoffs from 0-3.
It’s still too early to talk about whether Tomlin is or should be on the hot seat with his star QB out until at least 2020, but what we can say is that the Steelers have had a historic coaching situation over the last 51 years. Since the 1969 season, they’ve had only three head coaches: Chuck Noll, Bill Cowher, and Tomlin. There have been 5 popes during that time! Let’s dig into what we can say statistically about this feat of consistency. Continue reading “Pittsburgh Has Had The Most Consistent Coaching Run In The NFL”
Punting: The Stats, The Myths, And Robert F*cking Malone
Punting – we tend to take for granted that when it hits fourth down on our side of the field, our underpaid ex-soccer player will come out and bury the opposition deep in their own territory. But, as with so many things, it’s more complicated than that. How deep into opponents’ territory are teams willing and able to punt? Are announcers right when they talk about blocked punt opportunities when the punter kicks from the end zone? And why are so many punts underwhelming and unsuccessful?
Let’s dive right into the longest post yet on this blog. We’ll be using punt data from 2005-2018 regular seasons.
Continue reading “Punting: The Stats, The Myths, And Robert F*cking Malone”
Box Score Stats – Part 3: Trends

Welcome to part 3 of our two-part series on Box Scores in Football. Now that we’ve discussed Correlations and Distributions, we can take a brief look at how these stats have changed over the years – if at all.
A Complete Box Score Statistical Analysis – Part 2: Distributions

Here we are at part 2 of the megapost on Box Scores. If you missed the first post on Correlations, you can find that right here. We’ll be using the same 50 years of regular-season data in this post as we did last time, giving us about 22k samples to work with.
So what’s the deal this time? Here we’ll be looking at how each of these statistics are distributed relative only to themselves and not how they’re correlated to each other. Having these charts in hand will improve future discussions, as it will allow them to be more precise in terms of specifying where a team falls each of the distributions when talking about how good they are. Alternatively, you can point at them and laugh at exactly how low this year’s Browns are on all of them.
Also, for the more detail-hungry out there, I’ll be accompanying some of the more interesting football stat distributions with a brief discussion on their relationship to common statistical distributions.
Continue reading “A Complete Box Score Statistical Analysis – Part 2: Distributions”
A Complete Box Score Statistical Analysis – Part 1: Correlations
Aw yeah, it’s graphs and tables time, boys and girls. I (finally) have access to the final box score information (score, fumbles, pass attempts, sacks – you name it) for every regular season game in the Super Bowl era. 50 years, almost 14,000 games, more than 700,000 pieces of data. And what’s the first thing I did with it? Look at the general behavior of the data, first asking how the statistics are related to each other, and in the next post analyzing the distribution of each measure.
You may find this to be a pretty dry topic because there are so many numbers – it’s going to be a bit unavoidable in this context. However, it’s also a fascinating topic and I’ll try to give it the lengthy post it deserves. In a future post, we’ll look at how these stats have changed over time, if at all.
Continue reading “A Complete Box Score Statistical Analysis – Part 1: Correlations”
So, This Guy At The Bar Said There’s More Ties This Year Than Ever…

After the wild 6-6 tie last week between the Cardinals and Seahawks, we decided to export our ties to the land of soccer just a week later for a 27-27 tie between the Redskins and Bengals in London. Two ties in 7 days seems like a lot – is it historic? Well, there has only been two back-to-back ties like this once (in 1997) since overtime was implemented in 1974, but this isn’t a historic year – yet. Click through for the two graphs you need on this topic.
Continue reading “So, This Guy At The Bar Said There’s More Ties This Year Than Ever…”
How Bad Was Ryan Fitzpatrick’s No Good Very Bad Day?

Side note before starting – my analysis PC went down for about a month during a move to another country. Between those two things, it was very difficult to get any stats work done, hence the long gap. There’s a very large project in the works, though, so stay tuned. Here’s a post I started working on right before my PC died.
In Week 3 of the 2016 season, Ryan Fitzpatrick of the New York Jets had a bad day. He was playing against the Kansas City Chiefs and was given the ball 44 times to throw – around the 86th percntile – a relatively high number of pass attempts (chart shows 2009-2016.3).
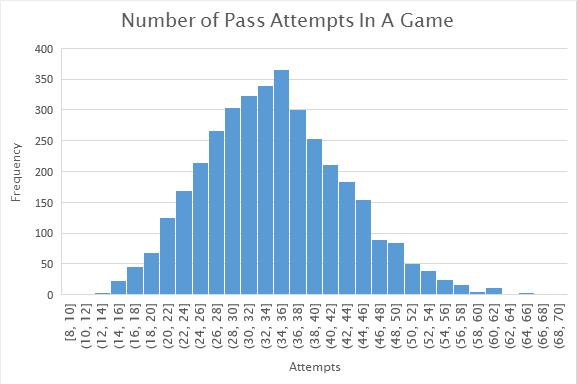
The bewildering thing about this high number of pass attempts (to anyone watching who had a brain) was the fact that over those 44 attempts, he threw six interceptions. This is a feat that, since 2009, has only been matched by two teams, not two quarterbacks. In 2011’s week 7, Oakland’s two QBs Carson Palmer and Kyle Boller combined with 3 interceptions each. In week 6 of 2009, Mark Sanchez’s 5 interceptions combined with Steve Weatherford’s 1 as the Buffalo Bills (helmed by…Ryan Fitzpatrick) took down the New York Jets. Jon Bois pointed this out in a series of tweets referencing his passer rating for the game as well as the fact that this hasn’t happened since 1989. However, Jon’s arbitrary cutoff of 43 attempts bothered me, since it was obviously designed to include Ryan while excluding other terrbile games. So how bad was Ryan’s day relative to all other recent quarterback outings?
Continue reading “How Bad Was Ryan Fitzpatrick’s No Good Very Bad Day?”

You must be logged in to post a comment.